The NOAA buoy data archive has recently been revamped. It has data from years into the past now, where it used to have only the last 4 months. I downloaded the last four years of data from the Bodega Buoy (number 46013). This buoy has been scheduled to be taken out of service, but miraculously keeps on ticking. Now there is a cryptic comment on the real-time data page for this buoy that says it is scheduled to be replaced on January 6th. If this buoy has already been replaced, this is good news for local surfers, wind surfers, fishermen, and ocean kayakers.
I averaged four years of data from the Bodega buoy to generate some plots of average wave height in every month. My analysis shows that January has the highest waves of the year, averaging 3 meters. This is why I have not been kayaking since Christmas Eve! It is common kayaker lore that the calmest ocean swells occur in the fall. I have sort of been hoping that there was a similar calm period in the spring. My own analysis shows, unfortunately, that the common lore is correct in this case.
 To try
and make sence out of the large amount of data available, I averaged huge
numbers of measurements together. Each point in this graph represents the
average of wave height at a particular hour of the day for a whole month
times 4 years (1993 - 1996), or about 120 measurements. This filters the
data until I can see general trends. The average wave height across a day
looks constant, but this is proably just the average of a uniformly random
wave height. This does "prove" that there is apparently no daily
variation in wave height. From month to month, this graph does show a patern
in the average wave height. The waves reach a peak of 3 meters around January,
and are lowest around September. My hope of another calm period in the
spring is dashed. I must wait until fall to plan my trip down the Lost
Coast of Mendocino.
 Since
the average didn't change much in 24 hours, I can sum the 24 samples a
day together and produce a single picture of an avarage year (solid line).
The dotted lines are the averages for the four years, to indicate a little
of the variability.
Years ago I aquired some data from NOAA about local wind speed and direction for the San Francisco Airport. This was the closest NOAA station I could find before I learned about the buoy stations. Now I can download this data from the archives on the WEB and do the same analysis with the Bodega Bay buoy which is closer to home.
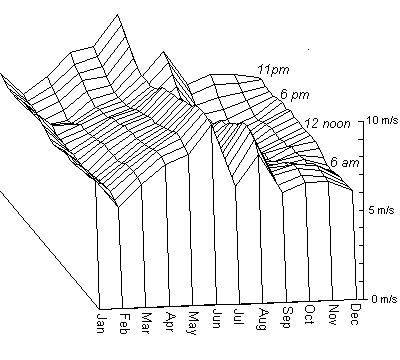
 In this
graph the wind speed does vary from hour to hour on an "average"
day, as well as showing a seasonal variation. Wind speed is measured in
meters per second. This graph confirms one conclusion I made from the old
data in the 1980's: The average wind speed is greatest in the summer and
lowest in the winter, contrary to intuition.
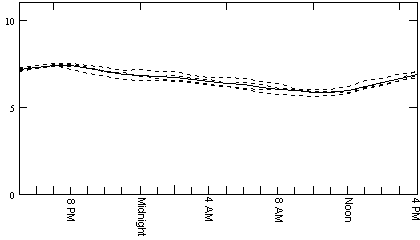
 The old
data was from the San Francisto Airport area and showed an almost square
wave of average wind speed over a 24 hour period. This data from the Bodega
Buoy shows more of a triangle wave with the lowest wind in the late morning
and highest wind in the evening. The San Francisco data had me convinced
to get up early before the wind rises. This data tells me I can sleep in
a little later if I'm paddling around Bodega. (The odd placement of time
on the axis is to convert GMT to PST).
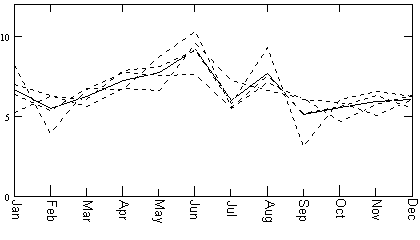
 This plot
shows the average wind speed in each month for 4 years (dotted lines) and
the 4 year average (solid line). If paddling into a headwind is your problem,
the fall is probably the best time to avoid both wind an waves.
 The dip
in July was so strange I had to look at the data in more detail to see
what is going on. This plot shows just the 3 month period around July.
Each point in this plot is the average wind speed for a single day (only
24 measurements) in 1996. The average wind speed seems to slowly climb
in the first half of the year until it is uniformaly high in June. Then
right around the begining of July the wind suddenly becomes much more variable,
but with a lower average. What does this mean for kayakers? In late summer
you have a beter chance of finding calm days than in early summer. But
you still have a strong chance of getting very strong wind on any given
day.